

As Australia advances policies targeting a 60% reduction in building embodied carbon by 2030 and net zero by 2050, carbon assessment is becoming a core practice. Cost planners, sustainability consultants, BIM coordinators, contractors, and project managers will need to align their endeavour to turn raw quantity schedules into reliable embodied carbon metrics, so as to enable broad collaboration to reduce carbon across all building stages and design maturities. This article will provide a step-by-step guide that anyone can follow.
Overview: The Six‑Step Workflow
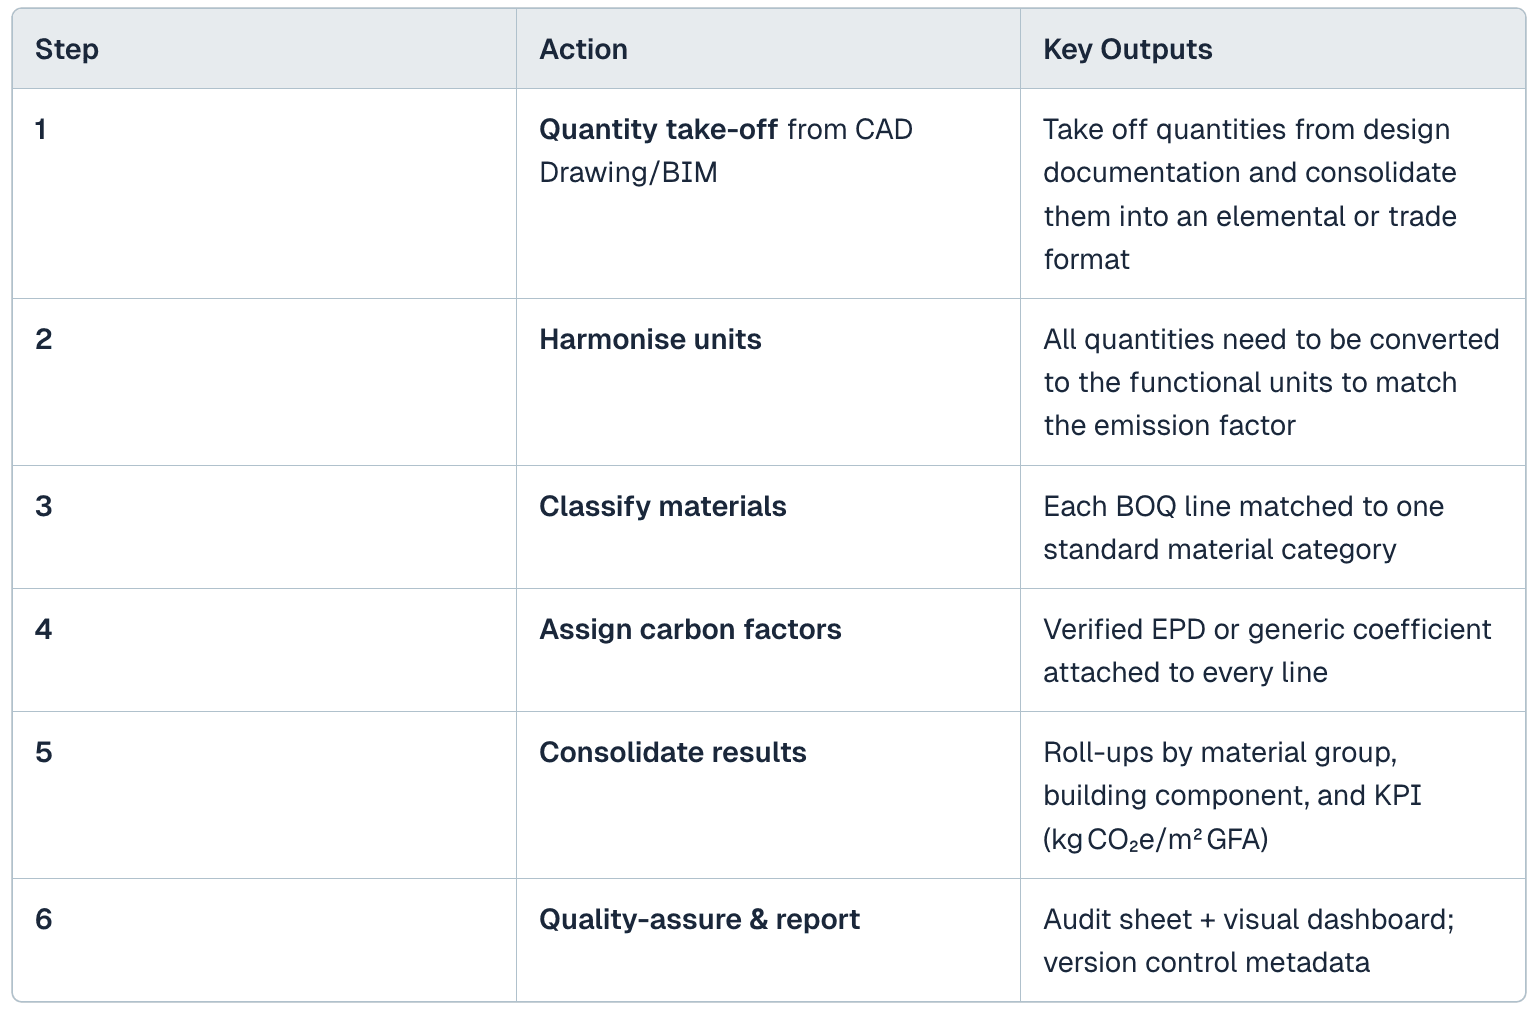
Below, each step is unpacked with practical tips, common errors, and quick checks.
1. Extract → Freeze → Label
1. Export directly from the source model (Revit, Archicad, Civil 3D) or manually take off from 2D CAD drawings
2. Include all geometry driving dimensions in the descriptions (thickness, length, height) if possible.
3. Freeze the file name and date (e.g., BOQ_R1_2025‑07‑15.xlsx).
4. Add columns for Material Categories and Unique ID - they will speed up later mapping.
Checkpoint: Can someone else open your file and trace any quantity back to a model element or drawing? If not, fix it now.
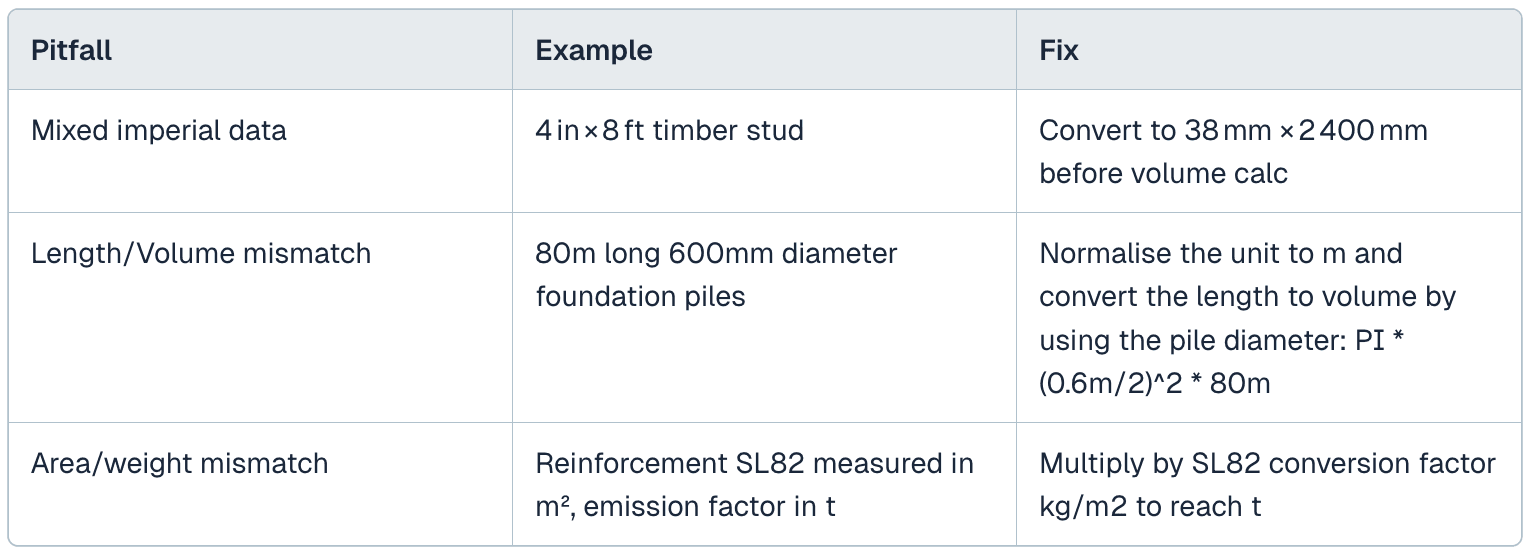
2. Harmonise Units — Your First Error Trap
Why it matters: Carbon factors are published in specific base units. A single mismatch (m² vs m³) can swing results by an order of magnitude.
1. Normalise to SI units
Length → m
Area → m²
Volume → m³
Mass → kg
2. Use a controlled conversion table (never hand‑typed formulas).
3. Automated red flags:
Missing thickness or density.
Decimal precision too low (e.g., 0 m³).
4. Log every conversion in a separate sheet.
Typical pitfalls & fixes
3. Classify Each Line Item — No Orphans Allowed
1. Read the BOQ description + spec section + IFC Material together.
2. Match to a controlled list (e.g., EN 15804 groups, RICS NRM, or your in‑house code).
3. Handle composites: Split or create a composite factor, and document the assumption.
4. Output: A Material Category column with exactly one code per line.
4. Assign the Right Carbon Coefficient
Follow this data‑quality hierarchy — and log which tier you used.
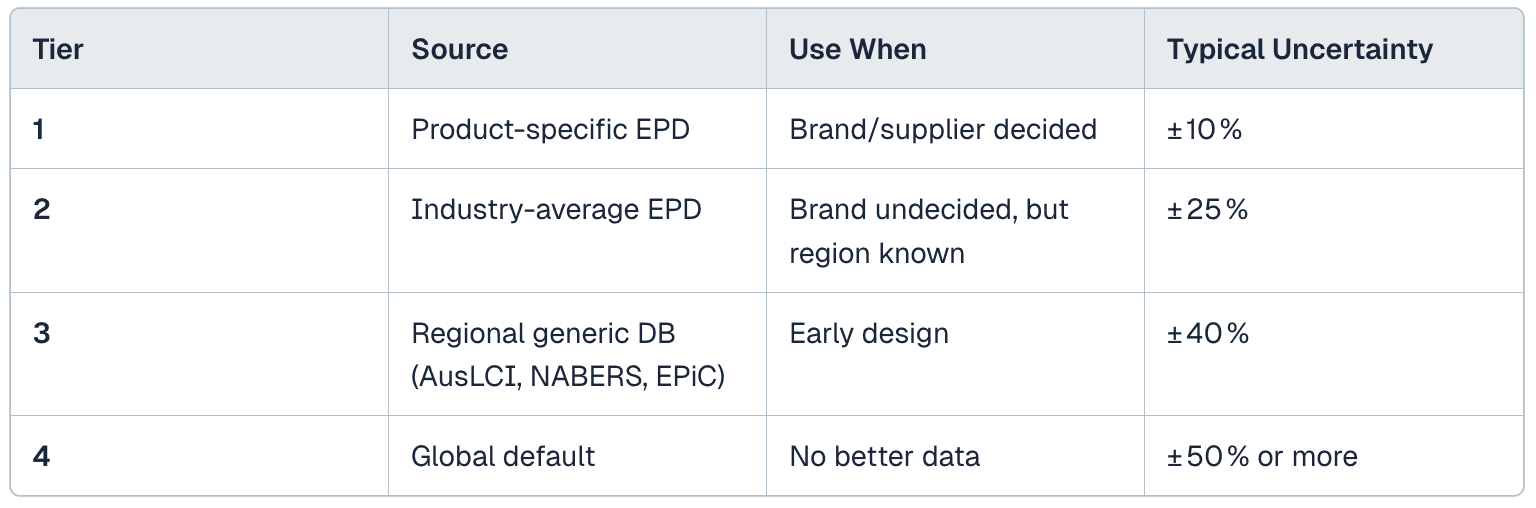
Practical tips
Store factors in a single lookup table keyed by Material Category.
Record EPD ID, date, modules covered (A1‑A3, A4, etc.) in adjacent columns.
If multiple EPDs exist, choose the most recent and geographically relevant.
5. Consolidate, Group, and Generate Insight
After every line carries a kg CO₂e value, roll up the data:
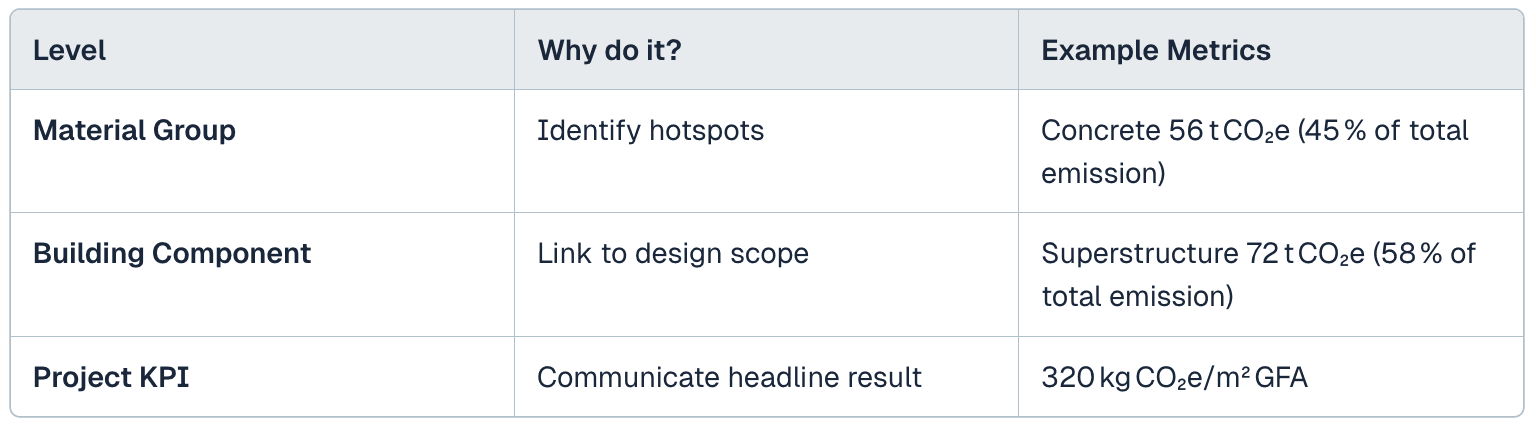
Tools: Pivot tables in Excel, Power BI dashboards, or Python scripts can automate updates as the design evolves.
6. Quality Assurance — Make Auditors Happy
1. Mass balance: Do total concrete volumes line up with the structural engineer’s calc sheet?
2. Source traceability: Auto‑generate an annex listing every EPD or database entry.
3. Spot checks: Randomly pick 5 lines each run; hand‑calculate carbon and compare.
4. Version control: Tag outputs with BOQ revision, factor DB version, and script hash.
Final Takeaway
By following this structured six‑step process, anyone can turn a raw BOQ into an auditable, decision ready embodied carbon assessment. The key is discipline in unit handling, transparent data sources, and rigorous QA. Master these, and you’ll move from reactive reporting to proactive carbon optimisation - exactly when it matters most.