
Overview
The built environment generates 39% of global energy-related greenhouse gas emissions. Around 28% comes from running buildings, while 11% is embodied in the materials and construction process. If current practices persist, these emissions will account for half of the climate impact of new construction between now and 2050.
Embodied carbon covers all greenhouse gas emissions locked into a building’s materials across their life cycle, starting with raw-material extraction and ending with demolition or recycling. Unlike operational carbon which can fall over time through energy-efficiency upgrades, embodied emissions are fixed the moment a project is delivered. As buildings become more efficient, embodied carbon can represent 40–70% of a project’s total life-cycle footprint. Meeting net-zero commitments therefore demands that we measure, manage and reduce these emissions from the earliest design decisions.
1. Embodied Carbon System Boundary
Embodied carbon is expressed in kilograms of CO₂-equivalent (kg CO₂-e), a single figure that brings together carbon dioxide, methane, nitrous oxide and other greenhouse gases. To ensure consistency, international frameworks such as EN 15978 and the RICS Whole Life Carbon guide break a building’s life into standardised stages or “modules”. Defining your boundary up front means everyone works from the same assumptions.
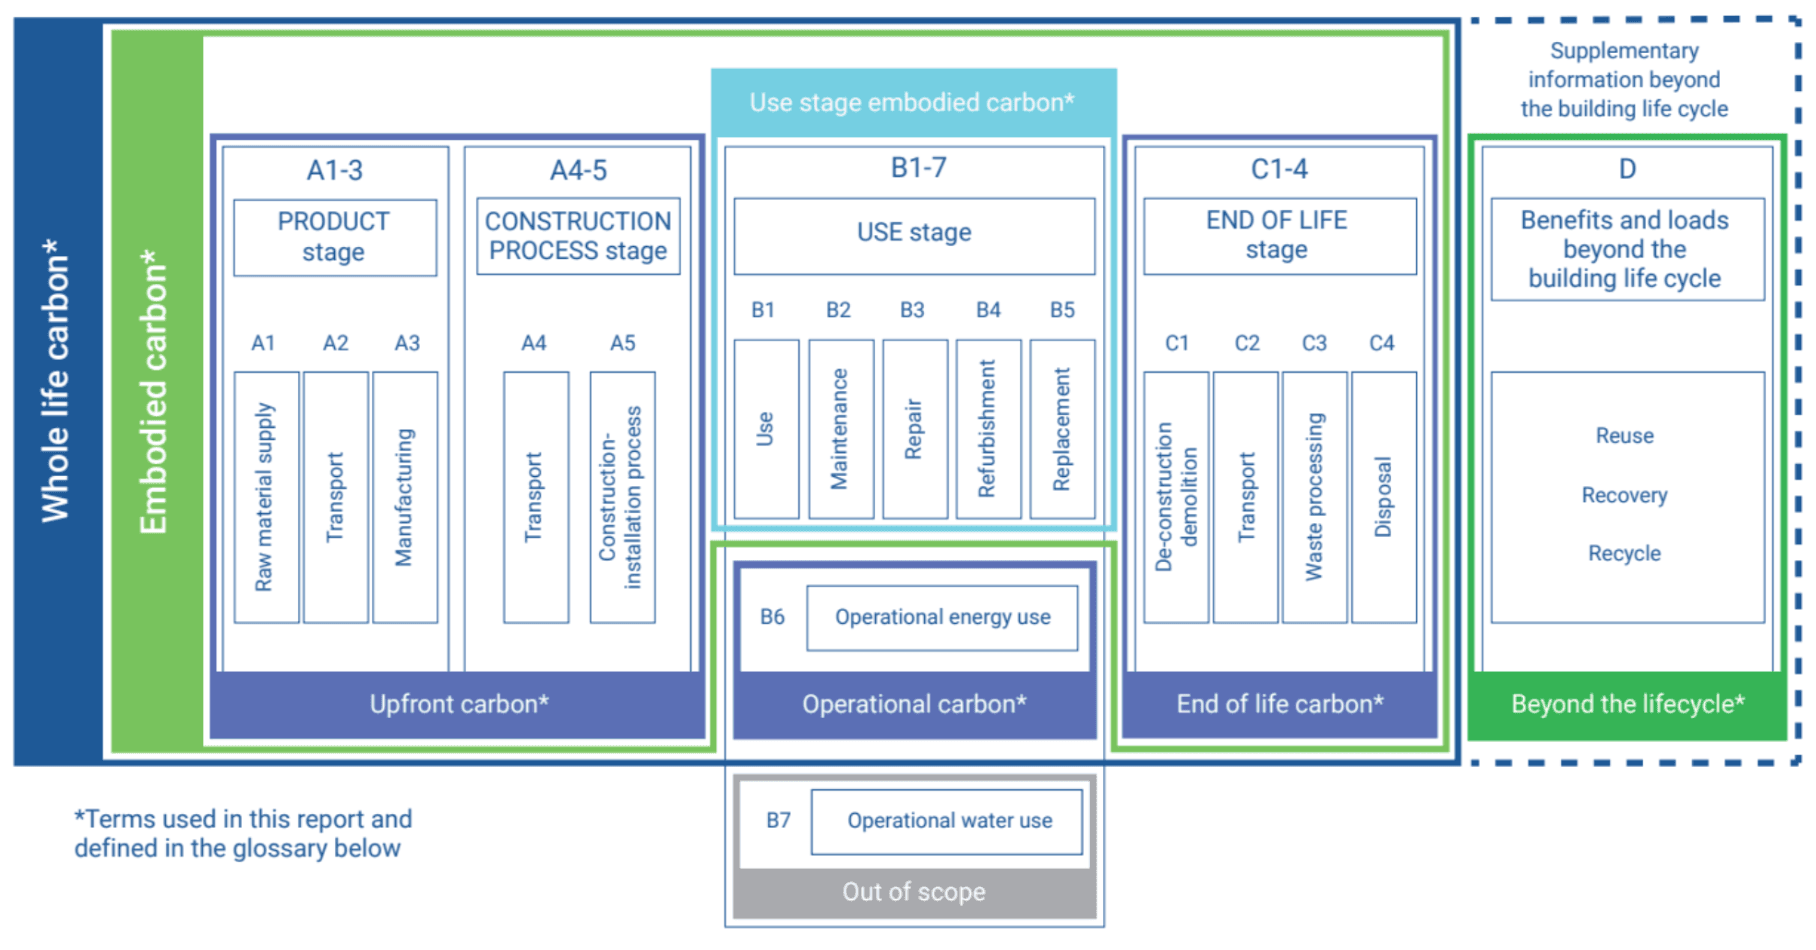
Most project teams start with a cradle to gate (A1–A3) or the broader upfront carbon scope (A1–A5) because data are more readily available and directly linked to design choices. If a whole-of-life assessment is required, assumptions like building lifespan, product service life and end of life process must be stated and documented clearly so that results can be reviewed and audited accordingly.
2. How to Measure Embodied Carbon
A structured approach ensures consistency and reliability. The high-level process is outlined below; detailed guidance for each step will be explained in our forthcoming Embodied Carbon Measurement series.
Define the scope and boundaries
Decide whether to cover only upfront stages (A1–A5) or the full cradle to grave life cycle (A1–C4).
Gather quantity take-off data
Extract material quantities from bills of quantities, BIM models or QS cost plans. Typical metrics include m3 of concrete, tonnes of steel, tonnes of aluminium and m2 of glazing.
Select reliable carbon factors
Prioritise emission factors from Environmental Product Declarations (EPDs) issued under ISO 14025 and EN15804. If no EPD exists, apply recognised databases such as NABERS’ Emission Factor Database or the AusLCI inventory.
Apply the factors to quantities
Multiply each material’s quantity by its carbon factor to calculate total emissions for each module.
Example: 100 m³ of 40MPa concrete × 240 kgCO₂e-/m³ = 24,000 kgCO₂e-
Compile and reconcile results
Sum emissions by modules, check against reference benchmarks and flag any anomalies. Document data sources, version numbers and calculation spreadsheets for audit.
Report and visualise
Present results in clear tables or charts, showing emissions by life cycle stage, material type and project phase. Use these insights to guide design decisions and set reduction targets.
3. Identifying Carbon Hotspots
Once you’ve quantified your project’s embodied carbon at the project level, the next step is to drill down into a targeted hotspot analysis. This involves two parallel breakdowns: by material and by building components.
Material breakdown:
List all materials in your project and their respective embodied carbon values
Rank materials from highest to lowest emissions. In most building projects, you’ll find that concrete, steel and aluminium dominate the footprint.
For each high-impact material, review supplier options, alternative products or recycled-content variations that can deliver equivalent performance at a lower carbon cost.
Component breakdown:
Separate your design into major elements, typically structure, façade, internal walls, finishes and services.
Allocate embodied carbon to each component based on quantities and material mix.
Identify which components contribute the largest share. In mid- to high-rise construction, the structural frame and external façade often account for 50–70 percent of total embodied emissions.
With the hotspots clearly mapped out, you can then:
Set reduction targets for each hotspot (e.g. 40% eduction in concrete emissions).
Develop mitigation strategies, such as: optimising structural design (e.g. slimmer columns, longer spans), substituting lower-carbon alternatives (e.g. high SCM concrete mixes) and specifying secondary materials with recycled content (e.g. recycled steel, aluminium).
Engage with design and supply teams to assess trade offs between performance, cost and carbon.
By focusing your efforts where they matter most, hotspot analysis transforms abstract carbon targets into concrete, actionable steps, empowering you to drive meaningful emissions reductions from the foundation up.
In summary, tackling embodied carbon is essential for the construction industry now. By setting clear boundaries, using a consistent measurement approach and targeting material and component hotspots, you turn complex data into focused actions.
In the next article, we’ll explore data foundations - how to source, validate and structure reliable carbon factors for every material in your design.