

Understanding embodied carbon across the built environment begins with knowing where and how data is sourced. In Australia, practitioners rely on a suite of “generic” databases, Environmental Product Declarations (EPDs), and bespoke benchmarks to set baselines, drive design decisions, and verify carbon reductions. In the second piece of Low Carbon Materials Hub's "Demystifying Embodied Carbon" series, we unpack each resource, compare their strengths and limitations, and offer practical guidance for selecting and documenting your project baseline.
1 . Digging into the Core Generic Databases
AusLCI (Australian Life Cycle Inventory) – https://www.alcas.asn.au/auslci-emissions-factors
Custodian / scope
Run by the Australian Life Cycle Assessment Society (ALCAS), AusLCI houses cradle-to-gate life-cycle inventory (LCI) flows for more than 400 locally produced materials and processes.
Update rhythm
Sector working groups add new unit-process datasets in most years; the carbon-factor spreadsheet is now on its fourth major revision.
Data structure
True LCI: mass and energy flows for each process that LCA software (SimaPro, openLCA, GaBi) can aggregate.
Strengths / limits
Local energy mixes, transport distances, and kiln fuels are baked in, giving genuinely regional relevance. Yet, only modules A1–A3 are covered, and temporal coverage varies (e.g., cement data from 2021 vs. plastics from 2016).
NABERS National Material Emission Factors Database – https://www.nabers.gov.au/publications/national-emission-factors-database
Purpose built for compliance
The database ships with the NABERS Embodied Carbon calculator and underpins every certified rating.
Content
Version 2025.1 includes ~110 material/product coefficients plus generic transport (A4) factors. Emission factors derive from ~3,500 recent product EPDs; each factor (default, max, median, min) reflects GWP values straight from those declarations.
How to use
1. Default values apply to materials without EPDs (including an uncertainty margin over the max value).
2. Projects are encouraged to swap generic factors for EPD-specific values, unlocking additional NABERS points.
EPiC (Environmental Performance in Construction) Database – https://msd.unimelb.edu.au/research/projects/current/environmental-performance-in-construction
Origin / scope
Developed by University of Melbourne with >1 000 cradle-to-gate embodied GWP, energy and water coefficients.
Methodology
Hybrid LCA (process + input-output) widens system boundaries, so EPiC factors are typically 10-25 % higher than process-only emission factors like AusLCI.
Delivery formats
Available as an Excel workbook, Python package (EPiCdb), and Grasshopper plug-in for Rhino, enabling direct integration into BIM and parametric models.
Other libraries used as “gap-fillers”
ICE v4.0 (UK) – 2024 update introduced data-quality indicators and EPD-based emission factors (https://circularecology.com/embodied-carbon-footprint-database.html)
GaBi thinkstep regional sets / Ecoinvent for specialist chemicals, imported products, or when a project spans APAC supply chains.
Take-away: These datasets are intentionally generic – great for early design or policy studies but fall short once procurement demands real, product-specific data.
2 . Why EPDs Are Different (and Usually Better)
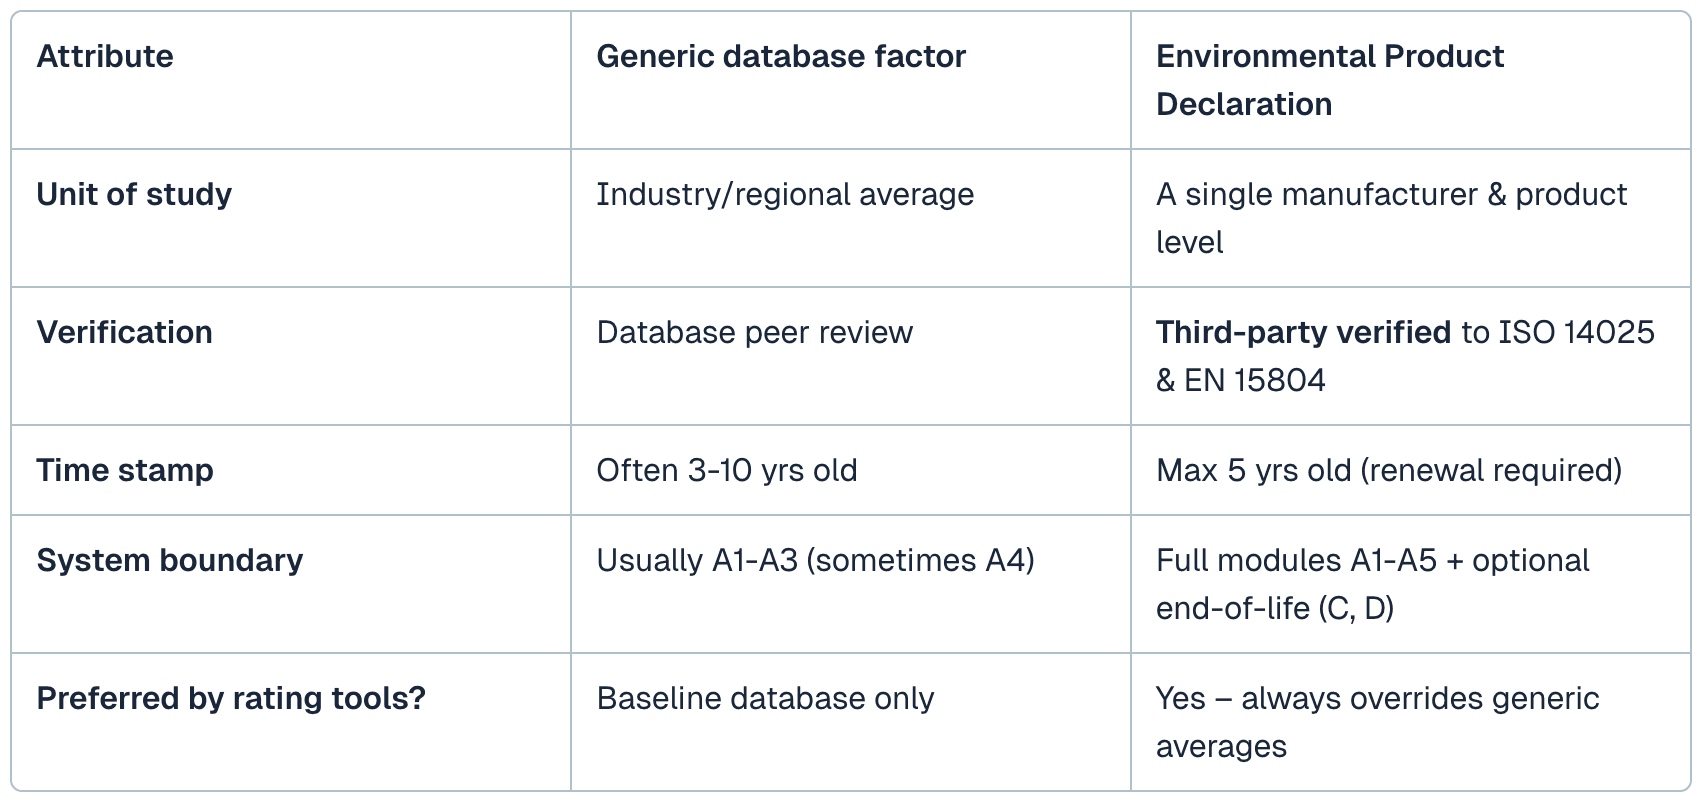
EPD Australasia now lists nearly 3,000 ANZ-region EPDs covering concrete, steel, insulation, façades, fit-out products, and more. Every declaration is independently verified and publicly downloadable (https://epd-australasia.com/).
You can also find digitised version at the Low Carbon Materials Hub (https://www.lcmhub.com/).
Practical Benefits of EPD:
Using an EPD tightens the ±25 % uncertainty band you inherit from database averages to <±10 %.
It unlocks additional points in NABERS, Green Star and IS ratings.
It gives procurement teams hard numbers when negotiating low-carbon options with suppliers.
3 . Choosing and Documenting Your Baseline – The Concrete Case Study
Consistency in baseline selection is critical. Mixing database sources mid-project creates incomparable results and risks misaligned carbon-reduction targets.
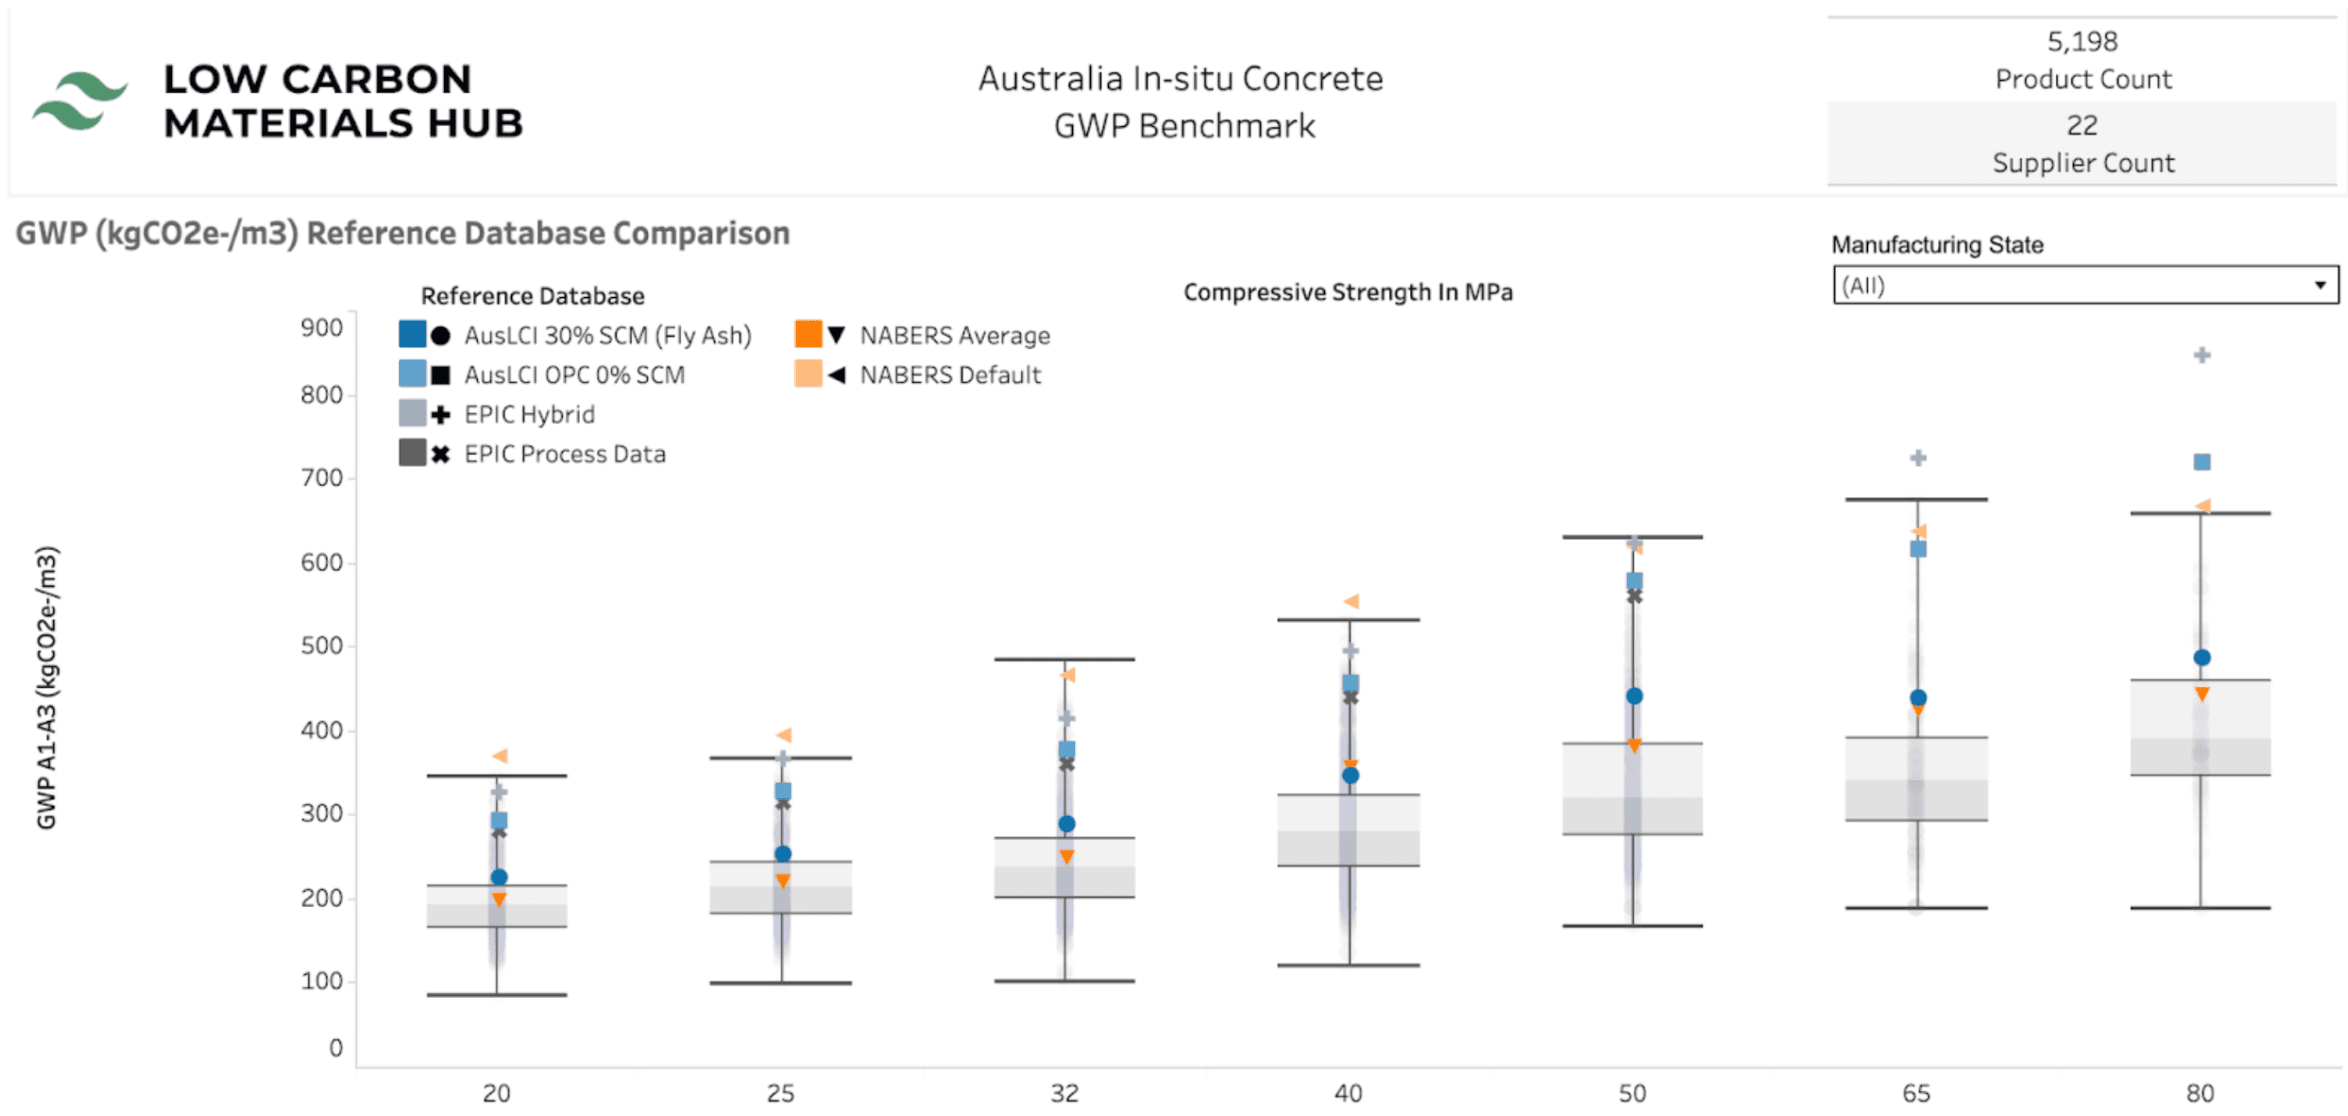
LCMH compared the three most used generic databases for 40 MPa ready-mix baselines – AusLCI, EPiC and NABERS. The spread is 357 to 556kg CO₂-e per m³ (36%) (https://www.lcmhub.com/resources/australian-concrete-reference-database-comparison).
Why it matters
Carbon-reduction targets
If a project aims to achieve “30% below baseline” for concrete products could mean ≤ 348 kg CO₂-e (if you use EPiC), ≤ 321 kg (if you use AusLCI) or ≤ 250 kg CO₂-e (if you use NABERS)
Design optimisation
Early-stage optioneering (slab thickness vs. higher-strength mix) might point you to different answers depending on the baseline.
Supplier claims
A 40 MPa concrete mix with an EPD of 413 kg CO₂-e looks “10% better” than AusLCI but “16% worse” against the NABERS average emission factor. Mis-aligned baselines can drastically derail value-engineering workshops.
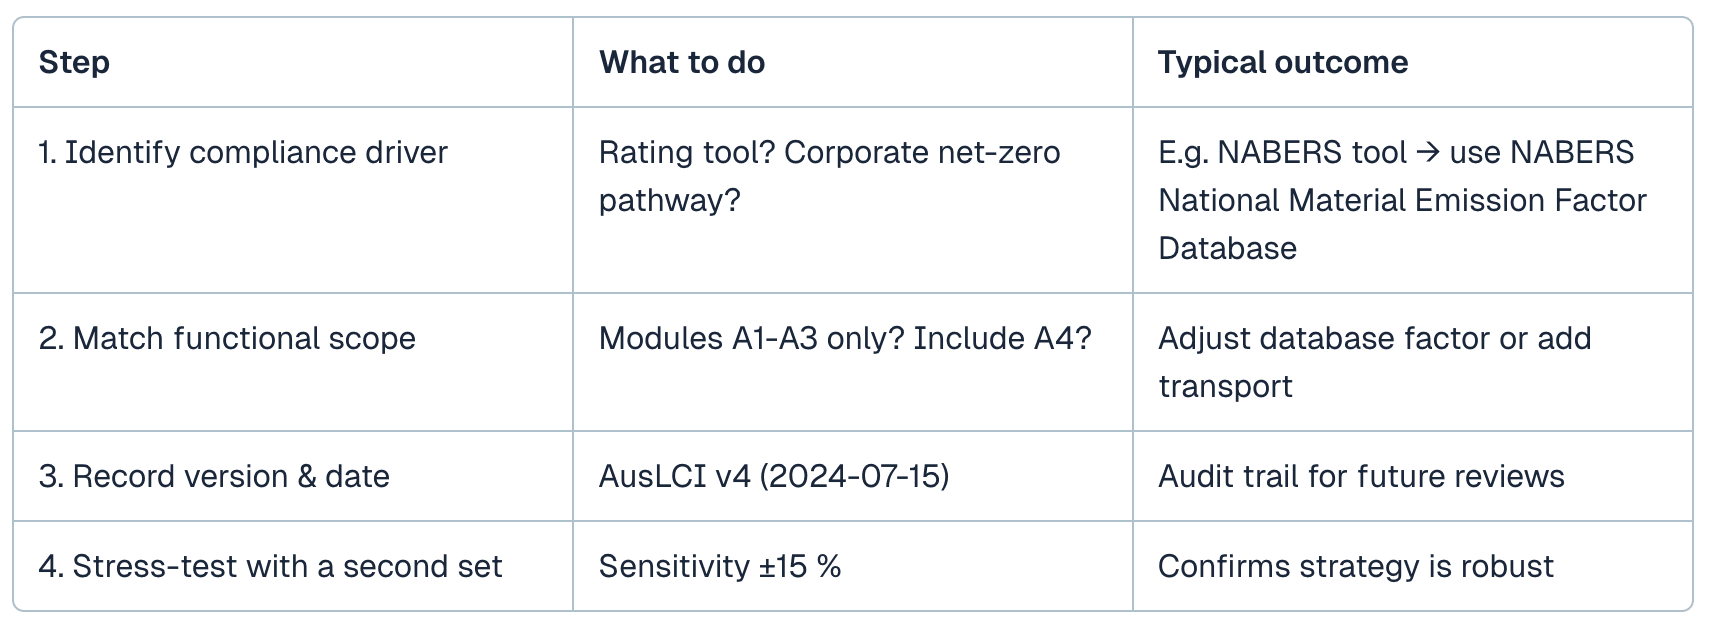
Baseline-selection checklist
Key messages for practitioners
Know what you’re holding – Generic databases are perfect for setting project baseline, but once procurement starts you’ll need EPDs or percentile market benchmarks.
Align your baseline with the end goal – Use rating-tool defaults for compliance; adopt percentile benchmarks for science-based targets.
Document everything – Capture version numbers, download dates, and any transport or scope adjustments.
Keep an eye on updates – Revisit AusLCI revisions, NEFD releases, and LCMH live-benchmarks before each design freeze.
As Australia moves toward a low-carbon built environment, the quality and consistency of embodied carbon data will be critical. By understanding the strengths and limitations of each data source and selecting baselines that align with project goals, practitioners can make more informed, credible decisions. Whether you're setting early design assumptions or verifying procurement outcomes, a clear, well-documented data strategy is key to driving meaningful carbon reductions across the sector.
In our next article, we’ll explore the first essential step of any carbon assessment: categorisation, grouping, and unit conversion.