
Australia’s built environment is moving rapidly toward embodied carbon transparency. Tools such as NABERS Embodied Carbon Rating, Green Star Upfront Carbon Credit, and the IS Rating Scheme all depend on robust EPD data to drive credible benchmarks and decision-making.
But when it comes to concrete application data—the information that tells us how a mix is actually used—the Australian dataset reveals critical shortcomings. Without accurate, standardised reporting of applications, the true potential of EPDs remains untapped.
Current State of Application Data in Australia
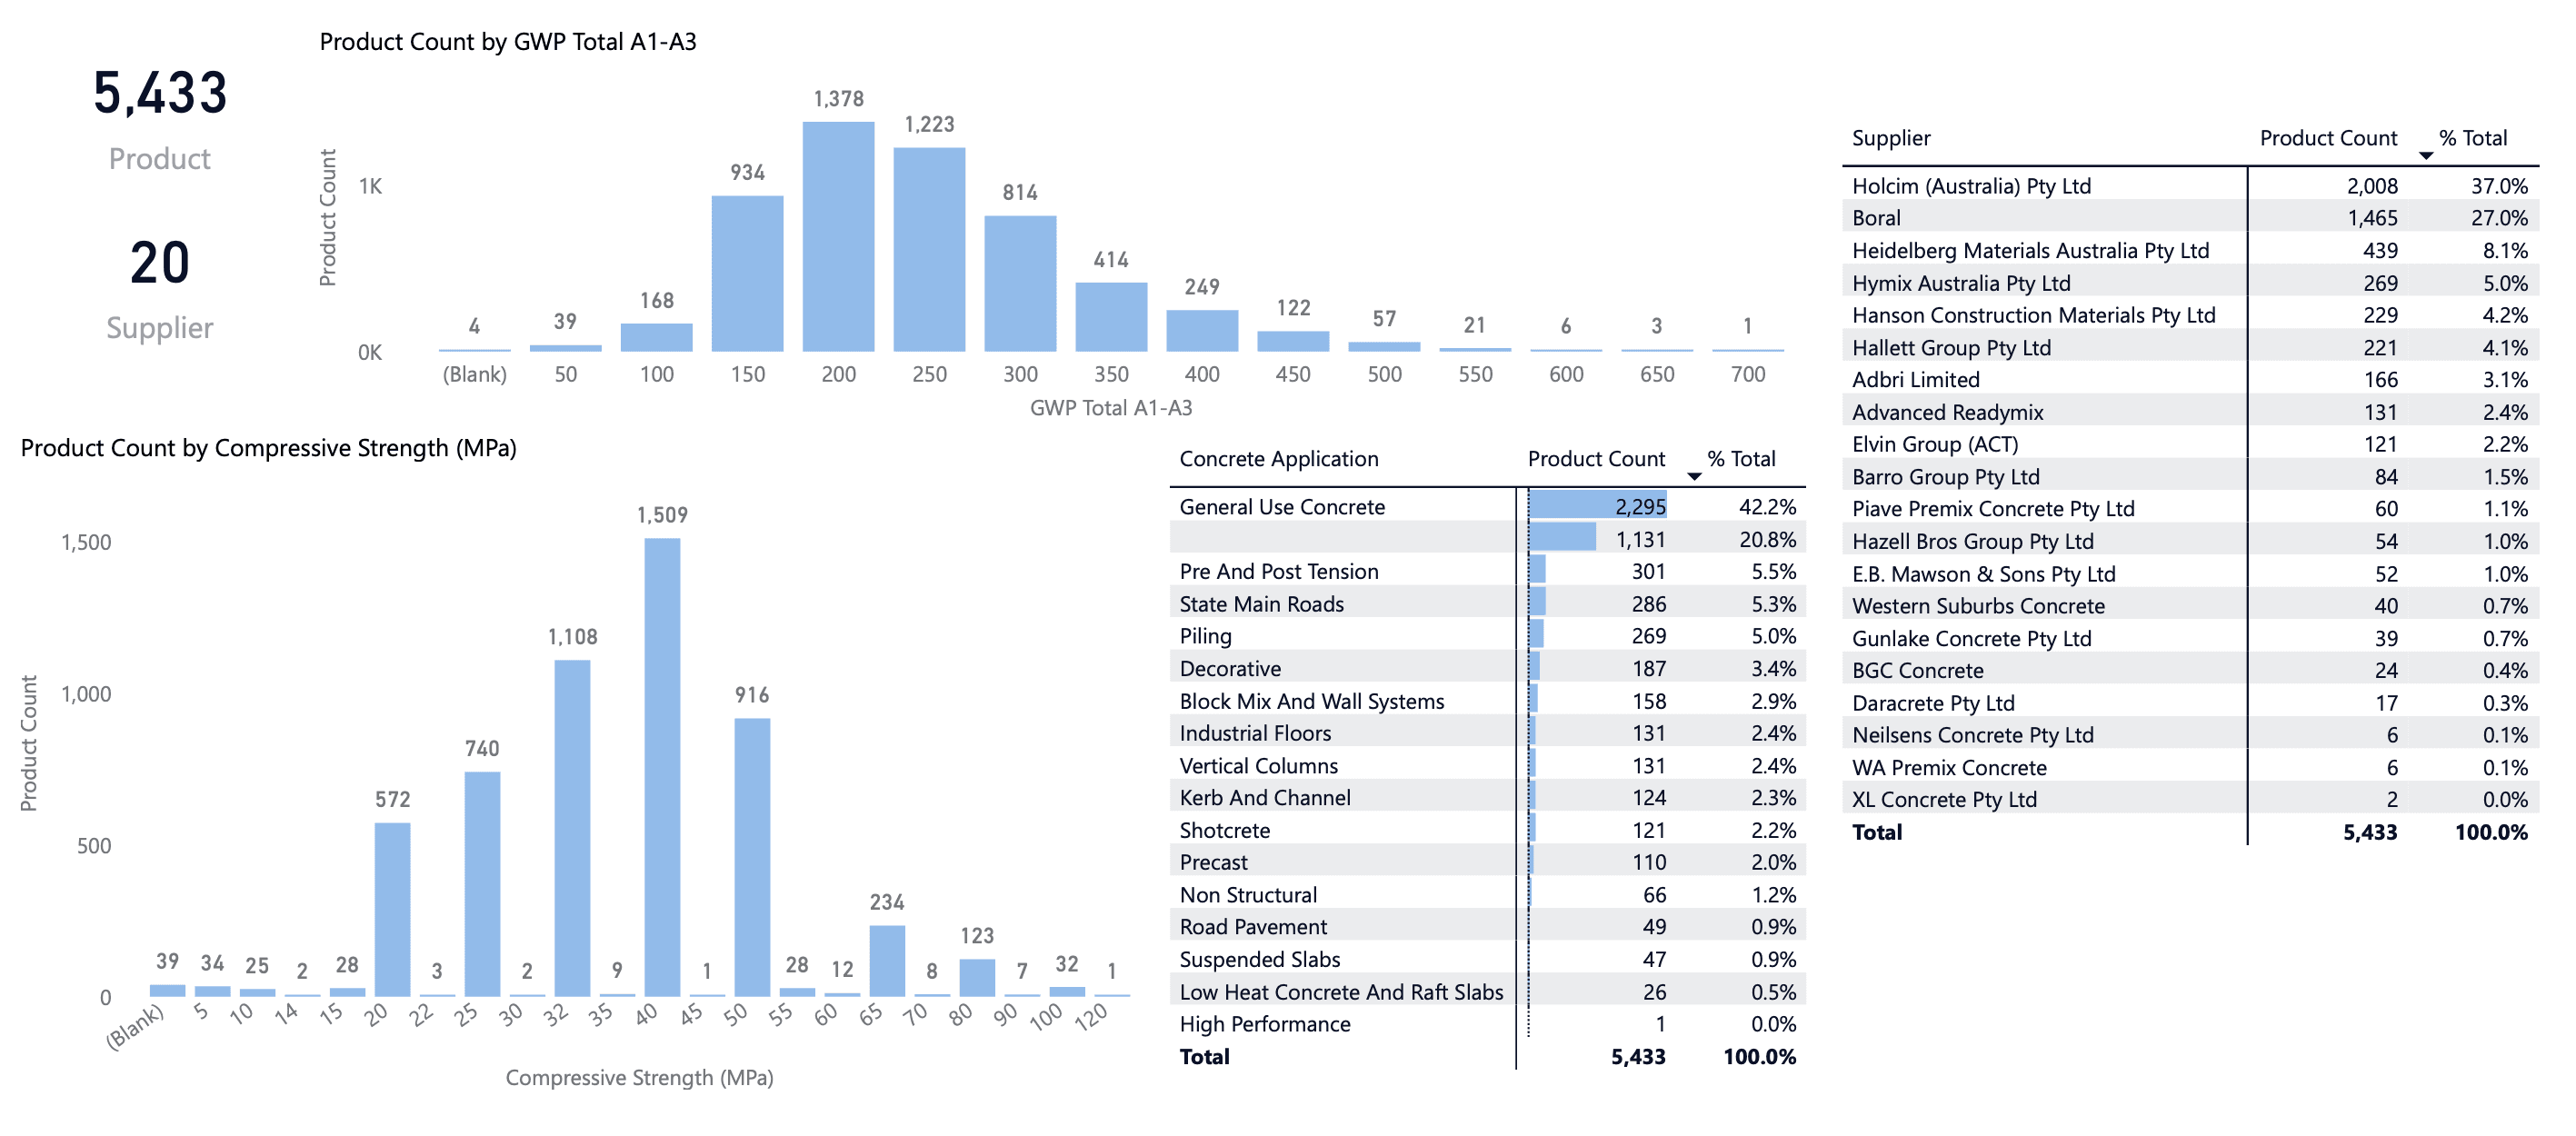
From Low Carbon Materials Hub’s dataset of 5,433 concrete mixes published by 20 suppliers in Australia, the picture is mixed:
Concrete with specific application tag: ~37% (2,007 mixes)
Concrete listed as “General Use Concrete”: ~42% (2,295 mixes)
Concrete with no application data at all: ~21% (1,131 mixes)
While “General Use Concrete” is technically an application category, it is too generic and high level to provide meaningful insight. Specifiers are left guessing whether these mixes are suitable for structural, pavement, precast, or specialist applications. This means over 60% of all Australian concrete products on the market cannot be tied to a specific use case.
Common Applications Reported
Where application data is provided, several categories are repeated across EPDs:
Pre and Post Tension – 20.8%
State Main Roads – 5.3%
Piling – 5.0%
Decorative Concrete – 3.4%
Block Mix and Wall Systems – 2.9%
Industrial Floors – 2.4%
Vertical Columns – 2.4%
Kerb and Channel – 2.3%
Shotcrete and Precast – ~2.0 to 2.2% each
These reflect the real demands of the Australian construction market from major transport infrastructure to residential and commercial buildings.
What The Data Tells Us
Over-representation of “General Use Concrete”: With 42.2% of mixes falling into this category, specifiers are left guessing whether a mix is suited to structural elements, pavements, precast, or specialty applications.
Application clusters: The most common categories are “Pre and Post Tension” (20.8%), “State Main Roads” (5.3%), “Piling” (5.0%), “Decorative” (3.4%), and “Block Mix and Wall Systems” (2.9%). These categories reflect major Australian construction sectors but together account for less than one-third of all reported mixes.
Fragmentation and overlap: Categories such as “Road Pavement” and “State Main Roads” are likely describing the same or very similar applications, yet they are listed separately. The same problem appears with terms like “Precast,” “Block Mix,” and “Wall Systems,” which share overlapping scopes but are treated as distinct categories. This inconsistency not only creates confusion for users but also makes it harder to compare data, aggregate results, or draw meaningful insights across projects.
Sparse data in niche applications: Critical areas such as “Precast,” “Kerbs and Channels,” or “Shotcrete” appear in low volumes (<3% each), making it difficult to establish benchmarks.
Restrictions The Industry Faces
1. Comparability limits: With inconsistent and incomplete reporting, comparing products across suppliers becomes unreliable.
2. Policy misalignment: Rating schemes increasingly demand project-specific data, but when suppliers don’t specify applications, assessors must make assumptions—risking compliance errors.
3. Lost decarbonisation opportunities: Without clarity on where concrete is being applied, it’s harder to identify high-impact areas (e.g. roads, slabs, or piling) where emissions reductions could be prioritised.
Why Application Data Matters
Concrete is not a single product, it is thousands of unique mixes, each designed for a purpose. Knowing the application is essential for:
Project-specific accuracy: Engineers can’t design responsibly if they don’t know whether a mix is meant for a bridge, a column, or a pavement.
Benchmarking carbon performance: Application data allows comparisons between like-for-like mixes (e.g. column vs column), rather than misleading averages.
Optimisation: With reliable application categories, the industry can target emissions reduction where it matters most, such as in roads, high-rise structures, or infrastructure works.
A Call to Action for Australian Concrete Suppliers
Suppliers are at the front line of change. Accurate reporting of application data in EPDs is not just a technical detail—it is a commercial and reputational opportunity.
By reporting applications clearly and consistently, suppliers can:
Differentiate their products in the market by showing suitability for specific uses.
Strengthen trust with specifiers, engineers, and contractors.
Enable their mixes to be seamlessly integrated into digital tools and rating frameworks.
Position themselves as leaders in Australia’s net-zero transition.
Towards a Standardised Framework
Industry organisations such as the Materials & Embodied Carbon Leaders’ Alliance (MECLA) are already working on a standardised set of concrete application categories.
This work is critical for:
Harmonising categories across suppliers so that each application group means the same thing whether the EPD is from Boral, Holcim, or a regional supplier.
Aligning with rating schemes and government policy to ensure application data supports regulatory and certification needs.
By supporting and adopting MECLA’s framework, the Australian concrete industry can eliminate ambiguity, unlock comparability, and accelerate its path toward net zero.
The Way Forward for Australia
For Australia to lead in embodied carbon reduction, the concrete industry must:
1. Stop relying on “General Use.” It provides little insight for design and benchmarking.
2. Report applications consistently. Every mix should declare its intended use.
3. Adopt MECLA’s standardised framework. Consistency across suppliers is essential.
4. Make application reporting mandatory. The Australasian EPD Program should enforce this requirement.
5. Enable digital integration. With structured data, tools like Nulla AI can deliver rapid, scalable carbon assessments.
Takeaway for our concrete industry: Over 60% of our concrete mixes still lack application data. Without it, the industry faces restricted comparability, slower digital integration, and missed opportunities for decarbonisation. By adopting a standardised framework, suppliers can empower consultants, contractors, and policymakers to make the informed decisions needed to achieve the net zero targets.